By Stefan Uhlig, Enrique Ortega Gironés & Jose Antonio Sáenz de Santa María Benedet [1]
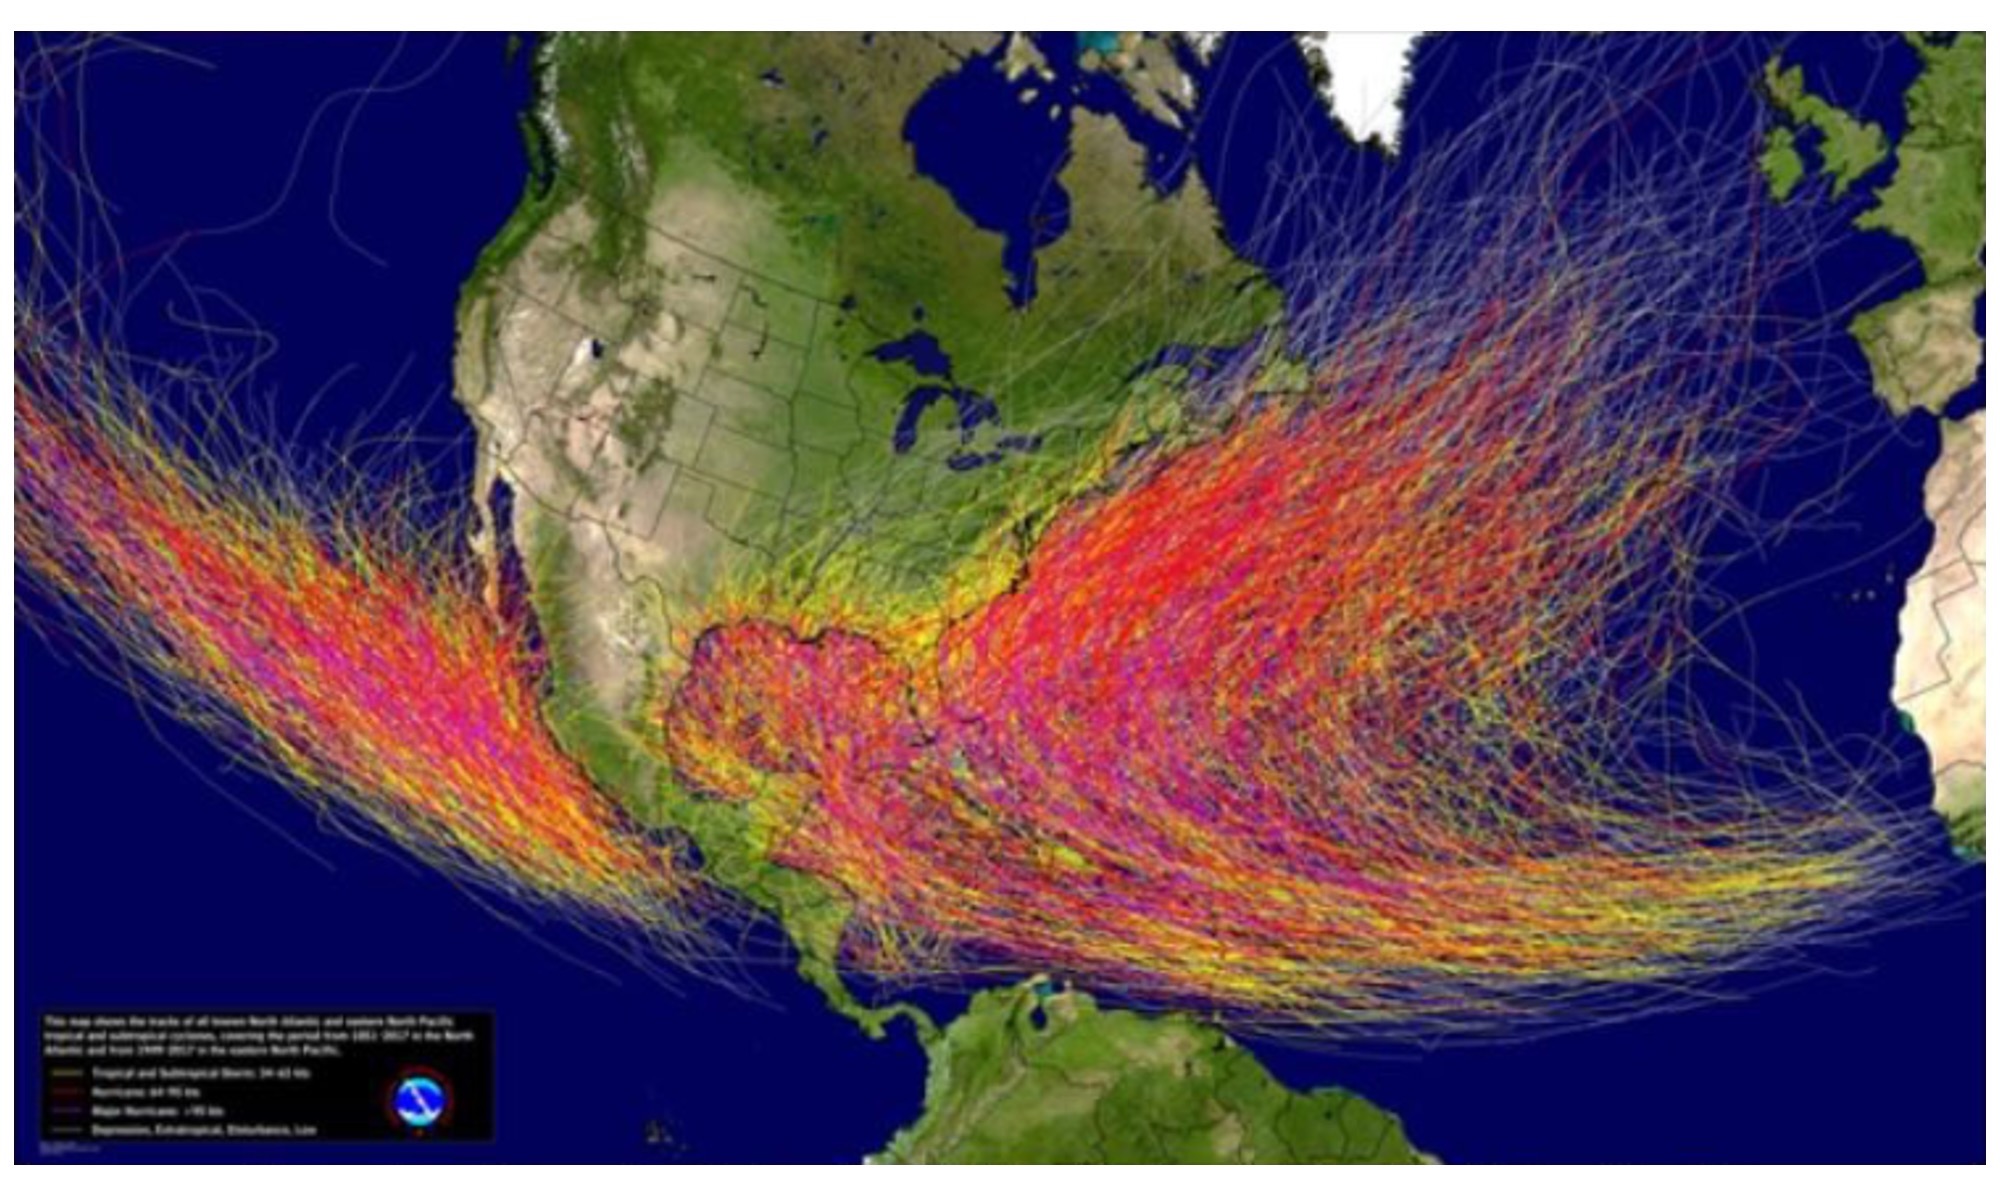
It is very common to hear in the media that, as a result of climate change, the frequency and intensity of extreme weather events is increasing. One such event is tropical cyclones, which are given different names depending on their geographical distribution: hurricanes in the Atlantic and Eastern Pacific, typhoons in the Central and Western Pacific, and cyclones in the Indian Ocean. Figure 1 shows the trajectory followed by the enormous number of tropical cyclones that have occurred in the North Atlantic (since 1851) and the Eastern North Pacific (since 1949).
The film industry has always a particular fondness for making films about disasters, so it comes as no surprise that Netflix has released a series called ‘After the Hurricane’, dedicated to the catastrophe caused by Hurricane Katrina. But is it true, as is often repeated, that the number and intensity of hurricanes on our planet is increasing? Historical climatology provides reliable information on the evolution of these meteorological phenomena, which, although extreme, are not extraordinary, as they are common in many parts of the world.
An analysis of more than 800 historical documents from the Spanish colonial period (logbooks of galleons crossing the Atlantic) shows that there was a significant increase in hurricanes and tropical cyclones at the end of the 16th and 18th centuries. In contrast, the 17th century was relatively calm, with fewer cyclones and fewer shipwrecks resulting from them. If we compare these historical data with the results of dendrochronological analysis of the growth rings of centuries-old pine trees, we can see that there was a 75% decrease in the number of tropical cyclones during the cold period known as the Maunder Minimum (1645-1715), when the number of sunspots and the energy received from the sun decreased, causing temperatures to drop significantly. During the three and a half centuries elapsed between 1500 and 1850, more than 600 Spanish ships sank while crossing the Atlantic as a result of hurricanes. These data show that during the Little Ice Age, a cold and obviously pre-industrial period, the Atlantic frequently experienced extreme weather conditions. Modern scientific research (meteorological and otherwise) shows that oceanic oscillations have a major influence on climate patterns and, therefore, also on so-called extreme weather events.
To understand these meteorological processes, it is necessary to take into account the enormous expanse of water that exists on our planet. The Earth has a surface area of approximately 510 million km2, of which about 70.7%, or approximately 361 million km2, is covered by seas and oceans. This immense volume of water makes the oceans the largest heat reservoirs on Earth and gives them a fundamental role, probably the most important of all, in the evolution of weather and climate. This importance is particularly noticeable in tropical areas (near the equator), where cloud formation over the oceans has a major influence on the evolution of sea currents and winds, surface water temperatures and other parameters. Furthermore, this influence extends to other oceanic regions far from the equatorial belt, towards the poles, influencing low cloud cover, a component that has a very large influence on the evolution of atmospheric temperature.
The interdependencies and interactions between the Sun, oceans and Earth’s atmosphere are highly complex, and we still have much to learn in order to understand them properly. For the purposes of this article, in order to understand the mechanisms that control their formation, we will briefly describe some cyclical phenomena that have been called oceanic oscillations. These oscillations represent periodic variations in the temperature and direction of movement of ocean water.
These cyclical changes are known to occur in all the world’s oceans, and their interaction plays a fundamental role in climate evolution. Thus, the North Atlantic Oscillation (NAO) interacts with the Arctic Oscillation (AO) controlling meteorological developments in European latitudes, as it is responsible for the contrasts between the area of warm air and high pressure in the Azores to the south and areas of low pressure and colder air in the north (Iceland area). The intensity of the North Atlantic Oscillation (NAO) is quantified by the so-called ‘NAO index’, defined by the differences between the average pressures at two reference weather stations, one in the Azores and the other in Iceland. When the difference is large, the NAO index is positive (NAO+). When the difference is low, the NAO is negative (NAO-). The NAO is responsible for multi-year climate trends, generating mild winters with abundant precipitation in central Europe when the trend is NAO+, while it conditions relatively cold and dry winters in the Mediterranean and North Africa regions when the trend is NAO-.
Another meteorological parameter of great importance is the AMO (Atlantic Multidecadal Oscillation), which describes the repeated cyclical changes in Atlantic currents that influence near-surface water temperatures, also affecting atmospheric temperatures in the northern hemisphere.
A positive AMO phase (positive AMO+ index values) occurs when warm water masses from tropical areas flow more often towards the north Atlantic, increasing the rate of ice melt. Negative phases (negative AMO- index values) correspond to weather situations with opposite effects, when warm water masses flow more slowly towards the north. The typical consequences of a negative AMO are lower temperatures in North America and Europe, while the polar ice mass increases. Conversely, the Arctic regions experience a decrease in ice during positive phases of the AMO, as has been the case in recent decades, although it appears that the current positive phase has been losing strength since the beginning of the new millennium.
The influence of the AMO is very important in the evolution of precipitation. Thus, periods of heavy rainfall in northern Europe correspond to phases of a negative AMO index and periods of low solar activity, while at the same time precipitation decreases in southern Europe, northern Africa and the east coast of North America.
Similarly, the AMO has a significant influence on hurricane development. If we analyse the number of hurricanes that occurred after the Little Ice Age, between 1856 and 2005 (see Figure 2), we can see that their frequency evolves in line with the cycles of the Atlantic Multidecadal Oscillation. The same graph also shows that the average number of hurricanes per decade has not increased significantly during the 20th century, despite reports to the contrary in the media, especially at the end of each summer.
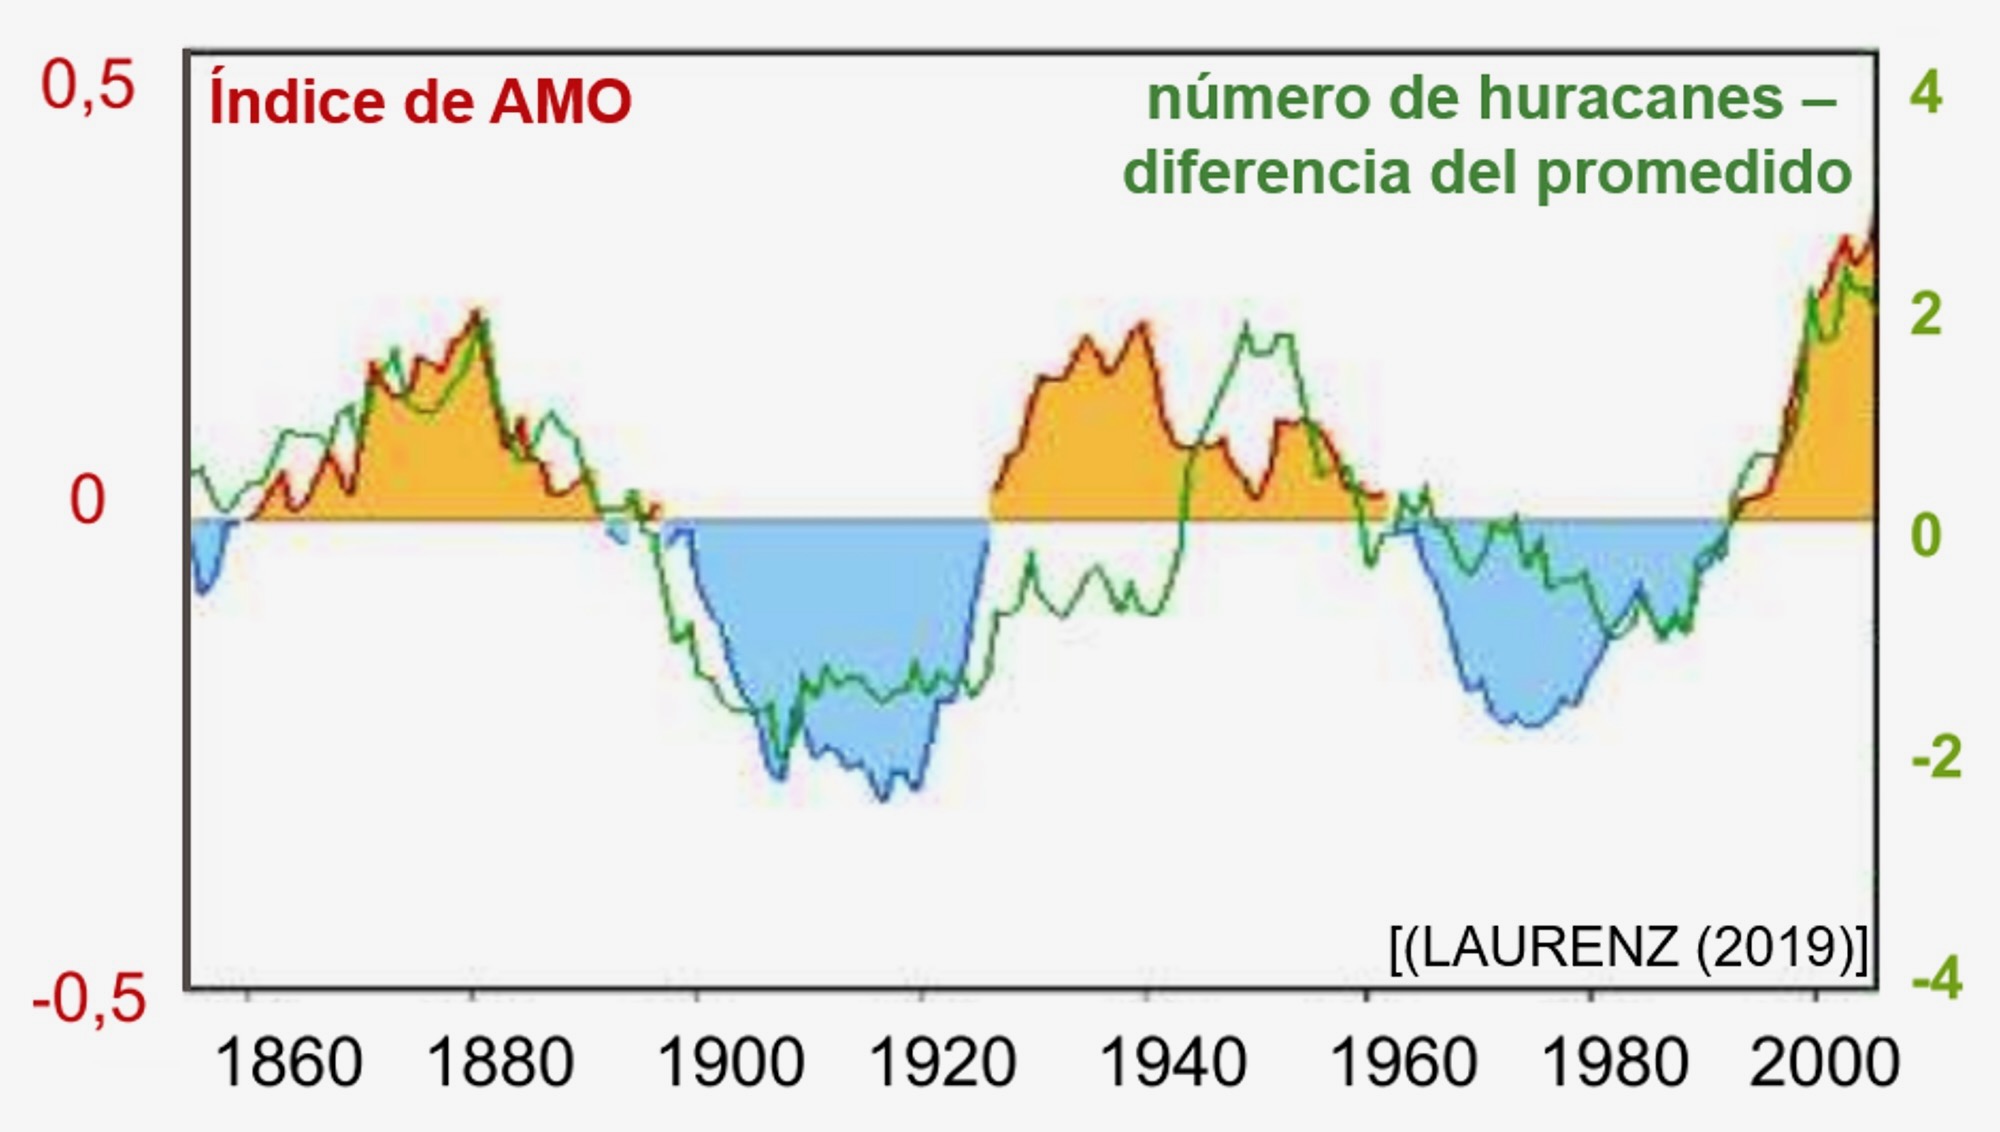
Complementing the data shown in Figure 2, records indicate that since 2005 the strength, duration and frequency of hurricanes in the North Atlantic have declined. In other words, there is no evidence that extreme weather events are intensifying in this ocean. AMO activity has been tracked for several centuries and, based on variations in the duration of each oscillation, the extreme complexity of the influences and interrelationships between variations in solar activity and changes in the oceans and atmosphere has been verified.
Scientific research carried out in recent decades is providing increasing evidence that the evolution of ocean oscillations coincides with short- and medium-term cycles of solar activity, such as the basic cycles of approximately 11 years, or their multiples, such as those of approximately 22 years, or cycles of approximately 50-70 years, as clearly shown in Figure 2. However, it should not be forgotten that the temporal evolution of these processes is very complex, as these short-term cycles are probably superimposed on long cycles lasting several centuries, in addition to the influence of solar activity cycles lasting one or two millennia.
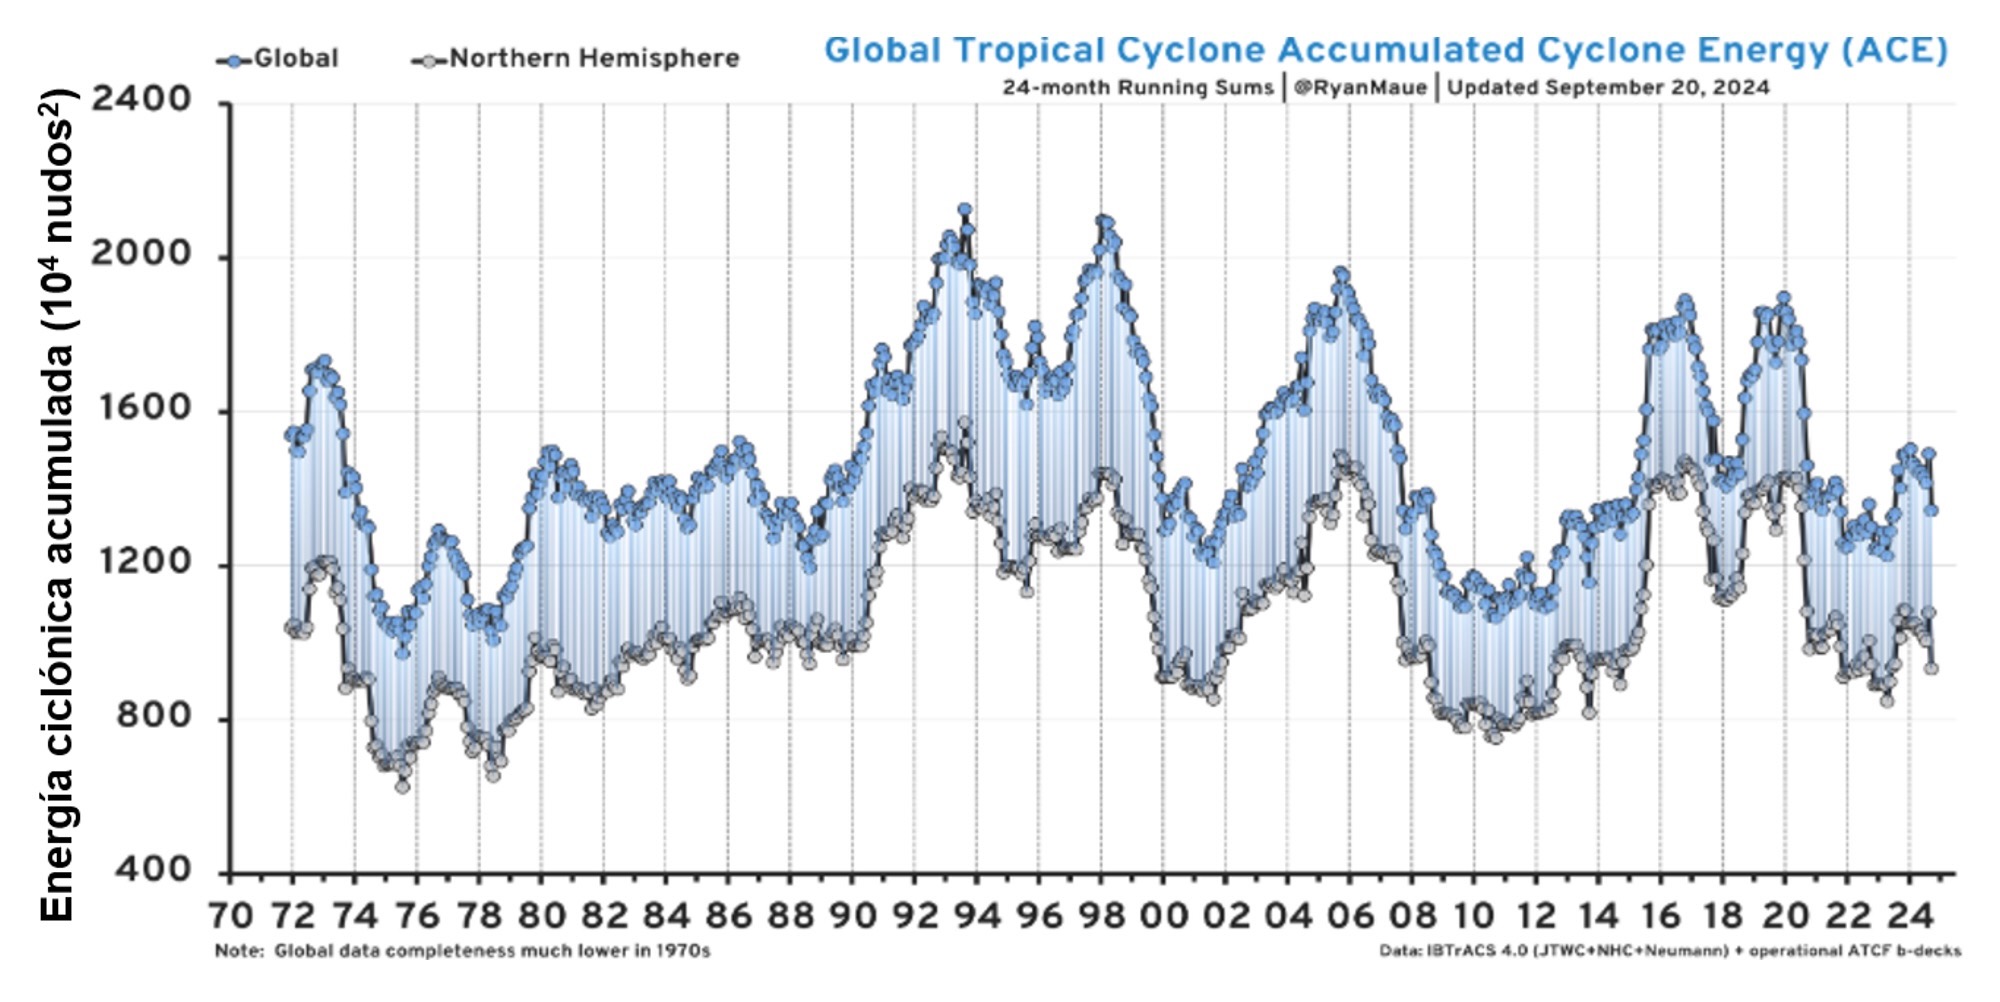
Another important parameter for characterising hurricanes and tropical cyclones is the measurement of accumulated cyclone energy (ACE). The energy released by cyclones is estimated based on their duration, speed and other parameters. Figure 3 shows the evolution of ACE (globally and for the northern hemisphere) since the 1970s. The graph does not show any increase in ACE over the last 52 years, but rather a periodic trend of ups and downs with a pattern similar to the evolution of the El Niño Southern Oscillation (ENSO). It is therefore clear that ocean oscillations have a major influence on climate development and tropical cyclone formation, and it is hoped that future research into the cyclical nature of solar activity and its influence on meteorological phenomena will contribute significantly to refining current climate models.
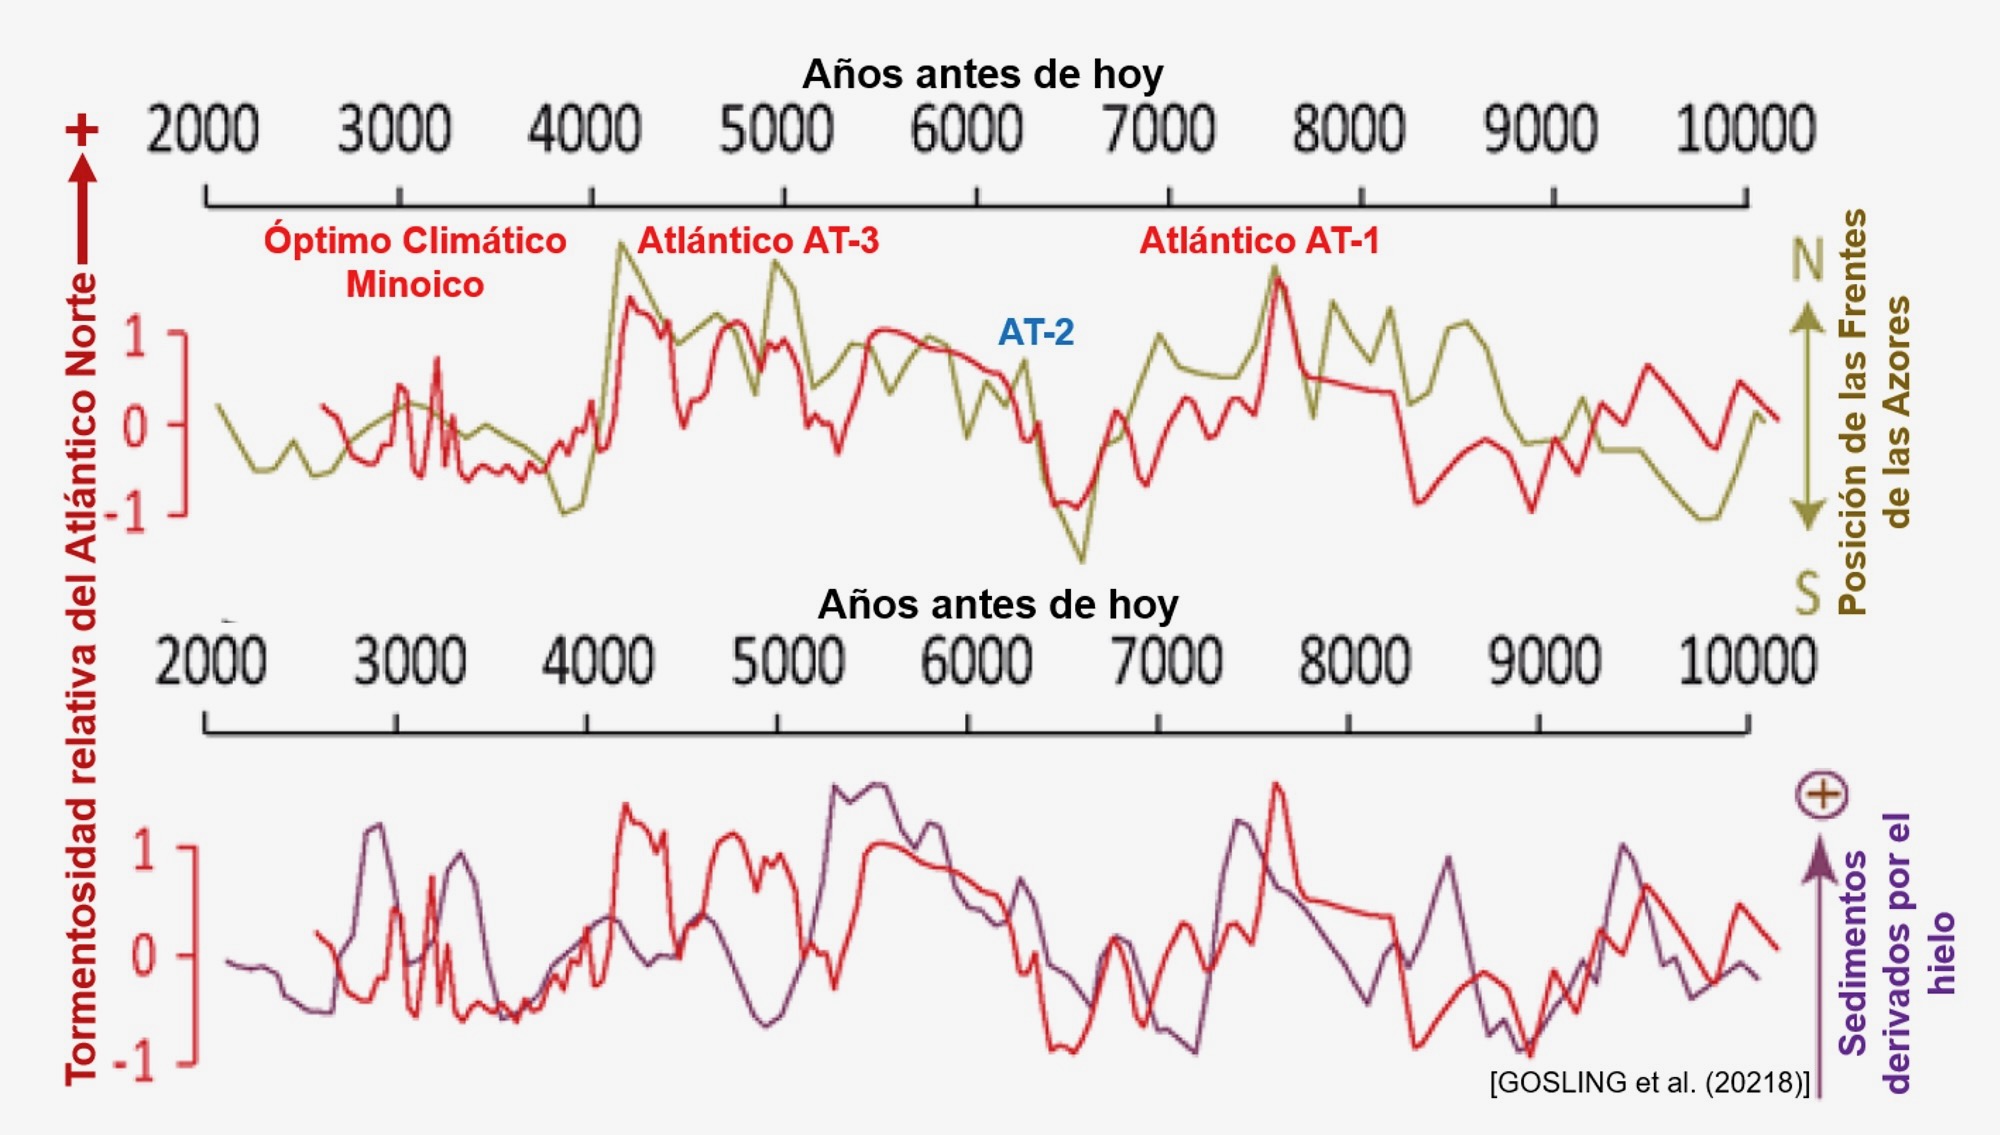
Going further back in time, geological studies carried out on sediments between 2,500 and 10,000 years old are very interesting. These studies have made it possible to determine the relative intensity of storms by measuring the wind speeds required to transport different fractions of sand grain sizes. The evolution of this intensity over time also indicates the existence of periodicities of approximately 200, 300 and 2,500 years, which coincide with the cycles of variation in solar activity. It has been interpreted that fluctuations in storm intensity influence precipitation patterns in northern Europe. As shown in Figure 4, there may be a relationship with changes in the position and influence of the Azores High and the polar vortex (upper panel of Figure 4).
These two atmospheric phenomena, which are of great meteorological and climatological importance in the North Atlantic, are controlled by oceanic oscillations, which in turn depend on incident solar energy. The lower graph in Figure 4 also shows how there is a correlation between sediment transport via icebergs (sediments derived from ice) and storm intensity. It is striking that the periods of maximum storm intensity coincide with the Atlantic Climate Optimum and the Minoic Period.
When discussing extreme weather events, we must not forget tornadoes, those whirlwinds whose air vortices, usually filled with spiralling dust, rotate on themselves and move across the land at speeds of up to 500 km/h, destroying everything in their path. They form mainly in regions and seasons where there are large temperature differences, for example, when the warm air of the Gulf of Mexico meets much colder land winds from the Rocky Mountains of the United States. These temperature differences tend to be greater during cold periods than during warm periods, when there is usually greater thermal equilibrium. Every year, these cyclones leave a trail of devastation in the United States, where, in addition to tornadoes (this word comes from the Spanish ‘tornar’), they are also known as twisters. When tornadoes move over the sea, their spirals fill with water and are called waterspouts.
Figure 5 shows the annual number of tornadoes in the 48 contiguous continental states of the United States (CONSU) between 1950 and 2022. The light blue curve shows the total number of tornadoes, the purple curve shows only those that are very intense (EF-2 intensity or higher), and the red curve shows the average annual number of sunspots, indicative of solar activity. In the United States, tornado intensity is classified according to their propagation speed, using a scale called the Enhanced Fujita Scale (EF), which goes up to EF-5 for extremely strong tornadoes. The weakest tornadoes in the EF-1 class reach speeds of up to 110 mph (~177 km/h), while those reaching higher speeds are classified as EF-2 and above.
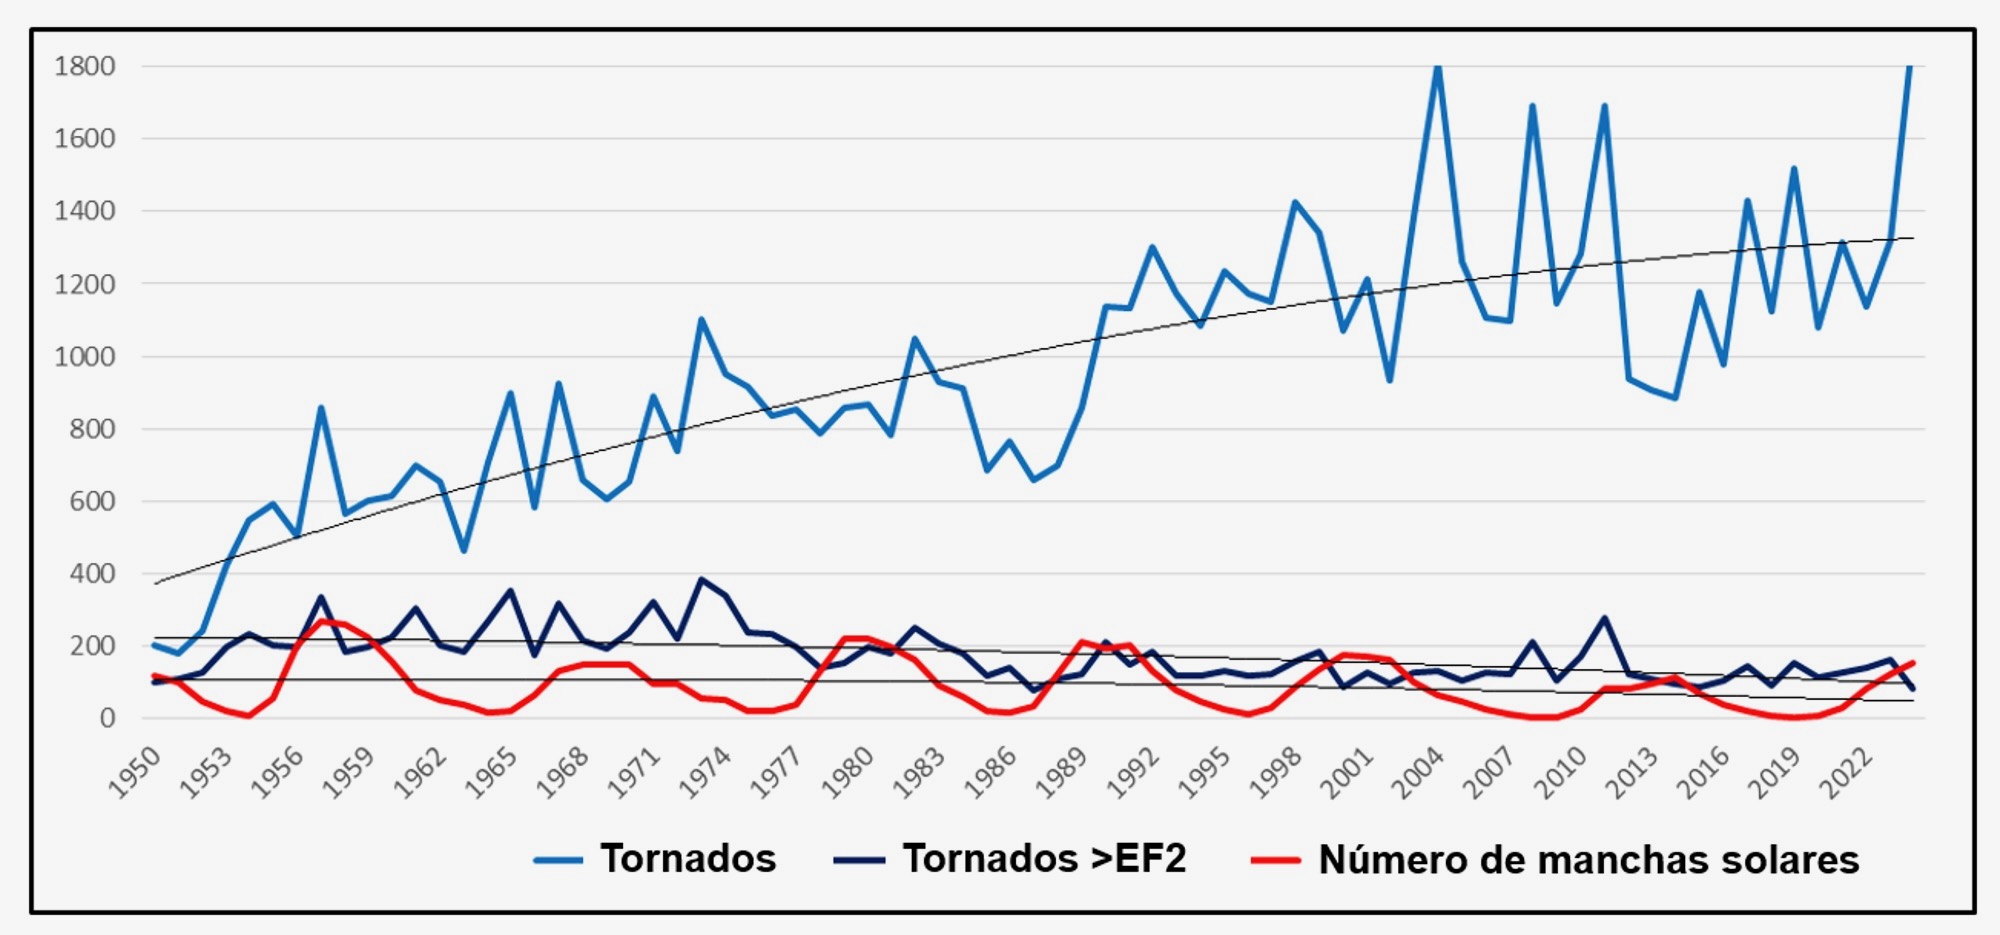
The graph in Figure 5 clearly shows that the total number of annual tornadoes has increased during the period shown, while the number of sunspots has decreased slightly (red line). However, it is curious that higher-intensity tornadoes decrease slightly, suggesting that lower solar intensity favours the formation of tornadoes, especially weaker ones, while more violent ones decrease. In any case, it can be seen that despite global warming (or perhaps because of it), the number of devastating tornadoes in the United States has decreased over the last 70 years.
The data in the graphs show that the interactions between the Sun, Ocean and Atmosphere systems are highly complex and we are still far from fully understanding them, both in terms of the present and the past, as they have been subject to constant change, even during recent geological times. Furthermore, we must not forget that the activity of these three systems can be altered by isolated, short-lived events, such as high-intensity volcanic eruptions.
Since its inception, humanity has feared the inexplicable meteorological phenomena that are now called extreme and cannot be controlled or mastered. In any case, statistical data on the evolution of these phenomena over time clearly indicate that there is no critical increase associated with a non-existent climate crisis, and that hurricanes and cyclones are occurring at the same secular rate that nature has always imposed.
But the world of science is very different from the universe of audiovisual communication having the widespread tendency to frighten the population with climate disasters. Just over a decade ago, two American films (‘Gasland’ and ‘Promised Land’), using biased and fraudulent arguments, managed to discredit the oil extraction technique of hydraulic fracturing (known as ‘fracking’) for the extraction of oil and gas. Their global impact was so great that many countries (such as Spain and the United Kingdom, for example) banned its use, even though this technique had been used in oil wells without any problems since the late 1950s.
Today, both in the United States and the United Kingdom, drilling for oil and gas extraction using hydraulic fracturing has resumed without any of the prophesied apocalyptic consequences (including the contamination of aquifers) having occurred. However, the taboo surrounding this technique still persists in global public opinion. Therefore, it will be not surprising that, despite all the statistical data and abundant scientific information, this NETFLIX series pontificates (and gets its way) about the terrible effects of climate change on the fury and frequency of hurricanes. Time will tell.
References:
[1] https://editorialaulamagna.lantia.com/libro/cambios-climaticos
ENFIELD, D. B., MESTAS-NUÑEZ, A. M. & TRIMPLE, B. J. (2001): The Atlantic multidecadal oscillation and its relation to rainfall and river flows in the continental U.S.- Geophys. Res. Letters 28, 2077-2080.
Ortega Gironés, E., Saénz de Santa María Benedet, J.A. & Uhlig, S: (2024): Cambios climáticos.- Aula Magna, 501 pp., ISBN: 978-8-410066-34-2.
GOSLING, J., FRUERGAARD, M., SANDER, L., GALKA, M., MENVIEL, L., MONKENBUSCH, J., THIBAULT, N. & CLEMMENSEN, L.B. (2018): Holocene centennial to millennial shifts in North-Atlantic storminess and ocean dynamics.- Scientific Reports 8:12778, 12 pp., doi:10.1038/s41598-018-29949-8.
LAURENZ, L. (2019): Einfluss von Ozean- und Sonnenzyklen auf Klimaveränderungen und Auswirkungen für den Pflanzenbau.- 44 Vortragsfolien unter www.reka-rheinland.de/ fileadmin/dokumente/Vortrage/2019_Klimawandel_REKA_7.03.2019_pdf.pdf.
UHLIG, S. (2025): Der natürliche Klimawandel: Fakten aus geologischer, archäologischer und astrophysikalischer Sicht.- Weltbuch Sargans, 367 pp., ISBN: 978-3-907347-35-5.
L’automne se marque bien sous nos latitudes, tandis qu’à Belém-Brésil se prépare une toute printanière « COP30, ONUsienne » ! La migration aérienne de plusieurs dizaines d’adeptes zélés et intéressés aura donc lieu (12 jours) en novembre 2025.
Si le grand public n’en a pas encore conscience, il suffit pourtant qu’il observe une effervescence médiatique parmi nos gazettes quotidiennes et petits écrans. Là-dedans se rédigent ou se déclament en long et large une floraison journalistique, celle coutumière du rapportage sur les « nouvelles études » de tel ou tel « centre environnementaliste ». Chacun de ces derniers répandant une fragrance de catastrophisme qui n’étonnera guère les gens correctement avertis…
En matière « climaxtique », le mot-clé sera GIEC-IPCC. Les sécheresses et incendies d’été alternant (ailleurs) avec d’impressionnants excès orageux régionaux, tous saisonniers, ça reste un des centres d’attentions de nos météorologues (dont s’inspirent aussi prestement des climatologues court-termistes pour mieux nous hurler un pire à venir)…
Ainsi au plan « bio-environnemental » défilent déjà des processions de foules apeurées. Elles scandent à l’unisson l’effondrement du vivant (sauf le leur).
Avec, au plan médical, en post-vague covid19 et une résurgence limitée 2024, sa variante actuellement décelée « Frankenstein ». En suivra encore le virus TERRITOR qui préfigure une pandémie terminale ! :o)
Dans un même temps, parfaitement synchrone, nos gazettes rapportent que :
« Une nouvelle limite planétaire est franchie, la septième sur neuf. » !
Il est donc quasi moins une… Là p.ex. un journaliste vertement attitré relate que le niveau d’acidification des océans dû à l’absorption du CO2 toujours présent dans l’atmosphère (en une teneur moyenne de 250-420 ppm), ne cesse de grimper et donc de « menacer » l’environnement…
Pourrait-on croire à l’une des prédictions (16e s.) de l’apothicaire Nostradamus ? NON ! Car ce sont des chercheurs du « Postdam Institute pour la recherche climatique »… si chers aux confrères GIECiens qui dénoncent les impacts humains mettant en péril le « bon fonctionnement des systèmes naturels » !!!
Tout ceci alors que d’autres études tendent elles à démontrer que ce même gaz pervers CO2 (sic) accroît positivement la végétation mondiale, entre autres en Amazonie: https://www.researchgate.net/publication/395844616_Increasing_tree_size_across_Amazonia
Ceci étant corroboré par l’autre source :
[[ A new Nature Plants study, covering 30 years of field data from 188 permanent forest plots across Amazonia, shows that the average size of Amazon trees has increased by more than 3% per decade . In plain English: the forest isn’t shrinking in stature, it’s bulking up.
The researchers found:
Mean tree size up 3.3% per decade
Largest trees (>40 cm diameter) increased 6.6% per decade
Biomass increasingly concentrated in the biggest trees
No evidence of large-scale die-off from climate stress
(… cont’d…)
https://wattsupwiththat.com/2025/10/01/the-amazons-co%E2%82%82-problem-turns-out-the-trees-love-it-so-does-the-media/ ]]
OUCHE, dans quel monde vivons-nous pourraient dire de vieux inquiets ?
Ben, voilà, nous nous réfléchissons AUTREMENT, avec un esprit ouvert et un sens critique sain : la perplexité reste de mise, c’est ça la science exacte.
Et ce ne sera pas le « consensus d’outils A.I. » qu’il faudra suivre !!!