by Alessandro Clerici* and Samuele Furfari**
*Alessandro Clerici (Honorary Chair of WEC Italy and of the Federation of Italian Scientific & Technical Associations)
**Samuel Furfari (Professor of energy geopolitics at the Free University of Brussels and President of the European Society of engineers and industrialists)
Disclaimer: The views and opinions expressed in this article are those of the authors and do not necessarily reflect the official position of the associations they represent.
1. Introduction
The European Green Deal triggered a great surging interest on hydrogen uses as an energy carrier particularly the so-called green hydrogen i.e. produced by renewable energy. This increasing interest for hydrogen (H₂), particularly ‘green’ hydrogen, is not limited to the EU. Huge electrolysis plants powered by renewable energy sources (RES) are announced in Australia, Chile, China, the Middle East, and North America, even if a giga project in Australia (the Pilbara one) has not got very recently the authorisation to proceed from the central government due to the strong impacts on the environment.
Hydrogen that burns to produce water vapour and can potentially be used in various sectors (industry, mobility, civil and commercial buildings) is fascinating. An extensive application of hydrogen has already been proposed several times, but unsuccessfully. Now that climate policy has led to a surge in renewable energy, particularly wind and photovoltaics, with investment costs per unit of power drastically reduced trigger new opportunities for a green hydrogen. It is considered that transforming excess of electricity into chemicals will solve the problem of green electricity storage due to its high variability and intermittency.
Not surprisingly, we are thus witnessing many media coverage on the future of H₂, with many figures on the increased efficiency and power of electrolysers, a reduction in the cost of H₂ per kg, jobs created, etc. But we observe that there are few numbers on the characteristics of H₂ and the cost – not so much per kg of H₂ – but of hydrogen energy for end users, including the costs of compression, transport, storage and distribution. Numbers are also limited on just the cost of green H₂ energy at the production site, so this article focuses mainly on this first step in the chain.
In a previous article published in The European Physical Journal Plus the authors highlighted that the great variability and intermittency of renewable energy impacts on the electrolysis because if the stack can partly cope with these fluctuations, the balance of plant of the whole electrolyser complex presents serious difficulties in the operation and the economy of what is presented as a new possible solution to cope with the CO2emissions reductions.
In this article we will consider mainly the opportunities and challenges still to be solved by a dedicated off-grid wind and/or solar PV plant feeding the electrolyser; this solution is seen by many organisations as an opportunity not to add grid costs to the cost of renewable energy production. In the calculations reported in this article, the values predicted for the cost of electrolysers by various agencies have been considered and it has been followed their usual practice that the electrolyser will work with a load factor equivalent to the capacity factor of the variable Renewable Energy Sources (RES) that power it. In the authors’ opinion this is impossible, given the characteristics of complex electrolysis plants, without adding or electrical storage systems increasing the cost of the electrolysis plant or some connections to a local and programmable energy source with a power infeed to be defined case by case. The results of calculations are therefore optimistic for the cost of hydrogen production; they are reported as the Levelised Cost of Hydrogen (LCOH). The LCOH is basically the average minimum price at which the green hydrogen generated by the electrolyser must be sold to compensate for the total production costs over its lifetime. The LCOH calculations were carried out considering the values of CAPEX (cost per kW) of the electrolyser and its efficiency today, in 2030 and in 2050, as a function of the price of electricity from RES and its capacity factor.
2. The EU proposals
The European Union now has 300 small/medium-sized electrolysers in operation, producing for specific chemical uses about 7 TWh of H₂, about 4% of total hydrogen production.
In the context of policies to achieve a climate-neutral economy, the European Commission (EC) published on 7 July 2020 the document ‘A Hydrogen strategy for a climate-neutral Europe’ where it sets that ‘from 2025 to 2030, hydrogen needs to become an intrinsic part of an integrated energy system with a strategic objective to install at least 40 GW of renewable hydrogen electrolysers by 2030 and the production of up to 10 million tonnes (Mt) of renewable hydrogen in the EU’. Additional 40 GW of electrolysers outside the EU are planned for H₂ to be imported. The European Commission foresees that from 2020 ‘to 2030, investments in electrolysers could range between €24 and €42 billion. Besides, over the same period, €220–340 billion would be required to scale up and directly connect 80–120 GW of solar and wind energy production capacity to the electrolysers to provide the necessary electricity.’
With this vision and the availability of substantial green fund to compensate for the economic recession caused by the current pandemic, the political, financial and industrial worlds of the EU Member States have launched themselves with frenzy and enthusiasm into identifying countless initiatives.
But the examination of the data in the EC document raises both doubts about their congruence and concerns about the possible costs of hydrogen production. Specifically:
- 40 GW of electrolysers with a super efficiency of 75% (currently forecasted only for 2050), with a maximum theoretical load factor of 8,760 hours/year and with a lower heating value (LHV) of hydrogen of 33.3 kWh/kg H₂ would give 263 TWh (40 × 0.75 × 8,760 = 262,800 GWh = 263 TWh) of green hydrogen equal to 7.9 Mt (263/33.3) per year and not 10 Mt (correspondent to 333 TWh in H₂ energy content). To produce the 10 Mt as the Commission is announcing it will be necessary to operate 50 GW of electrolysers and not 40 GW and this with a super efficiency not predicted now for 2030 and with an impractical load factor of 8,760 hours/year.
- Furthermore, 333 TWh of H₂ with 50 GW of electrolysers is only conceivable with an impractical load factor of 8,760 hours/year and, therefore, all electricity should be provided by a grid supply. This will require Power Purchasing Agreements (PPAs) with renewable energy sources connected to the grid to produce at least 444 TWh/year (333/0.75) in addition to those already programmed in order to reach the targets for 2030 and 2050 as defined by the EU. If not, the green electricity objective will be cannibalised to produce H₂.
- Considering for wind and PV plants in service in 2030:
– to have the present ratio of 1.5 between wind and power capacity in service in EU27
– an increase of 25% of their present average capacity factors (now 2050 hours/year and 1150 respectively for wind and solar PV according to Eurostat)
it would be necessary to connect to the network additional 157 GW of wind and 105 GW of PV plants (totalling 262 GW) producing 444 TWh/year and this for the sole production of green hydrogen; these 262 GW are by far above the 80–120 GW mentioned by the Commission.
There is no mention of what direct and indirect costs are attributed to hydrogen production alone, considering the necessary grid developments and extensions, system charges and ancillary services to be applied to the production price of the various renewable energy for their transport from the RES sites to the location of the various electrolysers. No mention is also provided to the regulation envisaged for the wheeling of renewable energy on the electrical system.
It is desirable that the European Commission explains how it considers producing its target of 10 Mt of green hydrogen with only 40 GW of electrolysers and what will be the foreseeable direct and indirect costs for the H₂ production alone and which kind of renewable electricity transport regulations are considered.
3. Present hydrogen cost
Let’s note that the lower heating value (LHV) of hydrogen, as mentioned above, is 33.3 kWh/kg (120 MJ) and therefore, if the cost of hydrogen is €1/kg, it means that the cost of 1 kWh is €33.3, i.e. €0.030/kWh or €30/MWh.
According to the International Energy Agency (IEA) at global level, the current cost of producing H₂ from fossil fuels (mainly methane) is from about €1/kg to €2.7/kg (and thus in energy terms from €30/MWh to €71/MWh) depending on local costs and on the possible capture of the CO2 produced. The cost of green hydrogen from electrolysis at the production site is estimated from 3 to €7.5/kg (and therefore from €90 to €225/MWh) depending on local costs of electricity from RES and related equivalent hours per year. Green hydrogen at the mouth of the electrolyser would cost about 3 times as much as black/grey or blue hydrogen and 7–17 times as much as methane on the EU energy stock exchange, equal to €13/MWh in 2020 (without carbon tax).

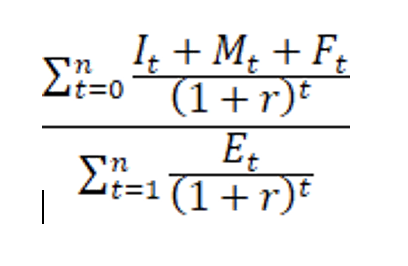
It is interesting to refer for the cost of hydrogen, to the LCOH already mentioned and which can be defined by a single formula recommended by the IEA where 1 is the year the plant starts commercial operation and at t=0, all costs incurred before the plant is in commercial operation must be included.
The various LCOH calculations presented in this article were carried out under various assumptions and those for 2020 are reported in this section:
- I = Investment costs
The capital expenditure of the turnkey electrolysis plant (CAPEX) is €1,000/kW to date as per IEA assumptions.
Pre-investment developer costs (not mentioned in the various scenarios but not negligible) such as choice of location, obtaining various permits, land purchase, feasibility studies and preliminary engineering of the plant and relations with renewable energy suppliers and possible customers for hydrogen purchase, preparation and issuance of the tender and subsequent award to a general contractor, etc. have been estimated at 15% of the total investment costs (this is probably a minimum for small medium size plants).
M = Operating and maintenance (O&M) costs
O&M in year t also includes the change of membranes and/or the complete stack and are evaluated by the suppliers of large plants at around 5% of CAPEX each year. The possible cost of renting the land should be added if it has not been purchased;
- F=Electricity expenditure in year t provided by RES purchasing agreements
- E = Hydrogen production in year t
Depending on the power of the electrolysis plant and its load factor (LF);
- r = Discount rate
In % (considering inflation, taxes, return on investment, financial charges, etc.). IEA considers 8% while some investors give higher values depending on the desired investment return and involved risks;
- n = Operating life of the system in years
Typically, Levelised Costs are calculated for electrolysers with an operating life of 20 years.
The electrolyser CAPEX per unit power, the capacity factor of the electricity supply (as mentioned above assumed in an optimistic view to be equal to the load factor of the electrolyser) and the electricity prices are key variables in determining the cost of producing green hydrogen.
Figure 2 summarises the value of the LCOH as a function of the cost of the renewable energy feeding the plant for various load factor values. Apart from the possibility of operation and the value of the investment considered for energy supply from an isolated wind or photovoltaic plant, LCOH values can also be deduced for a supply from the grid by including appropriate energy costs and capacity factors. For Italy, both the LCOH value based on the last auction awarded for wind power (€68/MWh) and those considered as a trend by some operators for new wind and photovoltaic plants with an electricity price of €50/MWh and capacity factors of 1,500 and 2,500 hours per year respectively are shown; these values are well above the national and European averages which are around 1,100 and 2,100 hours per year.
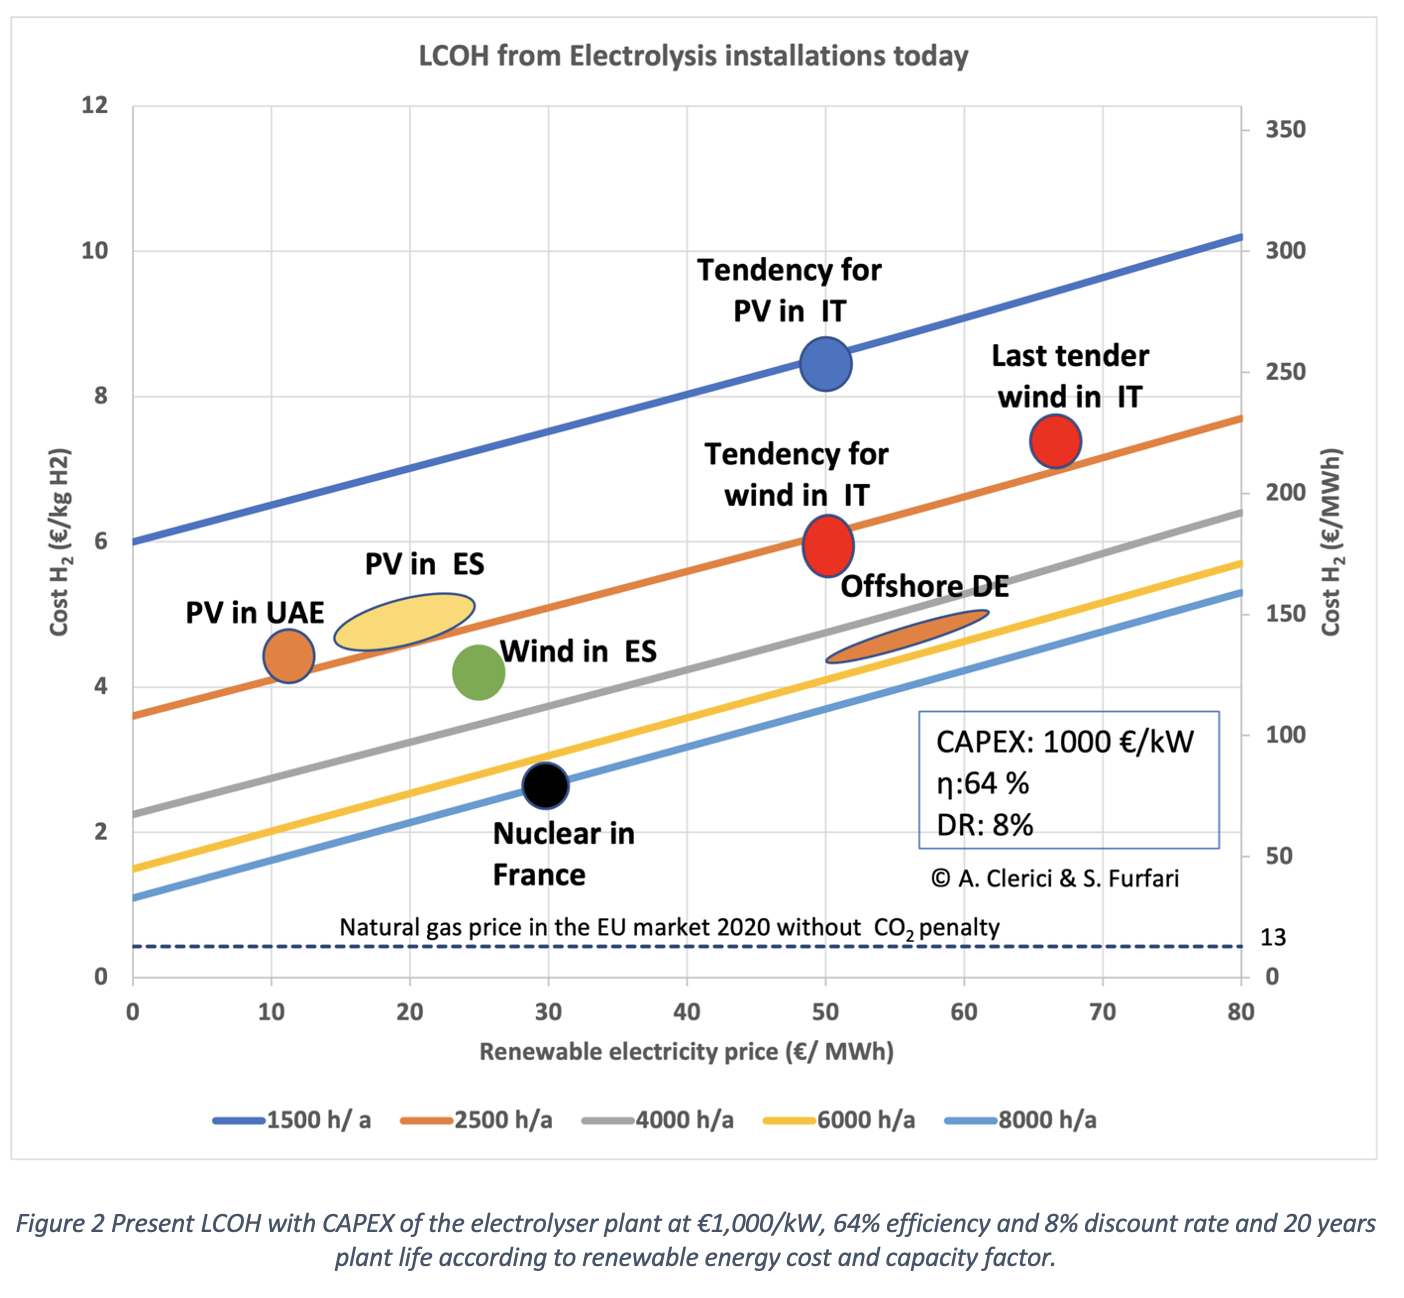
It can be seen that the projected €50/MWh trend price for PV and wind power in Italy would give €8.5 and €6/kg even with a higher capacity factor than the current average. Apart from Italy the figure shows the most interesting values based on the results in €/MWh from the latest auctions for photovoltaic electricity in the United Arab Emirates and Spain and the forecasts made by EC for offshore wind power in Germany and UK, including connection charges between the offshore plant and the onshore grid. For photovoltaic plants the recent contract in Saudi Arabia of $10/MWh has not been included. It can be seen that a blue hydrogen produced in France from amortised nuclear power plants with safe life extension would cost around €2.5/kg. In case of large electrolysers above 100 MW the CAPEX could be around €700/kW and would bring the value of LCOH from photovoltaics and wind power to around €6.7/kg and €5/kg respectively.
From Figure 2 it could also be deduced that, for a grid-connected electrolyser using PPAs from renewables at €50/MWh but with transport and ancillary system costs of about €25/MWh (and thus an energy cost of €75/MWh), the LCOH value correspondent to about 7,000 hours of load factor would be just under €5/kg H₂.
4. LCOH in 2030
Figure 3 is similar to Figure 2 but with values for CAPEX and efficiency of electrolyser’s relevant to 2030
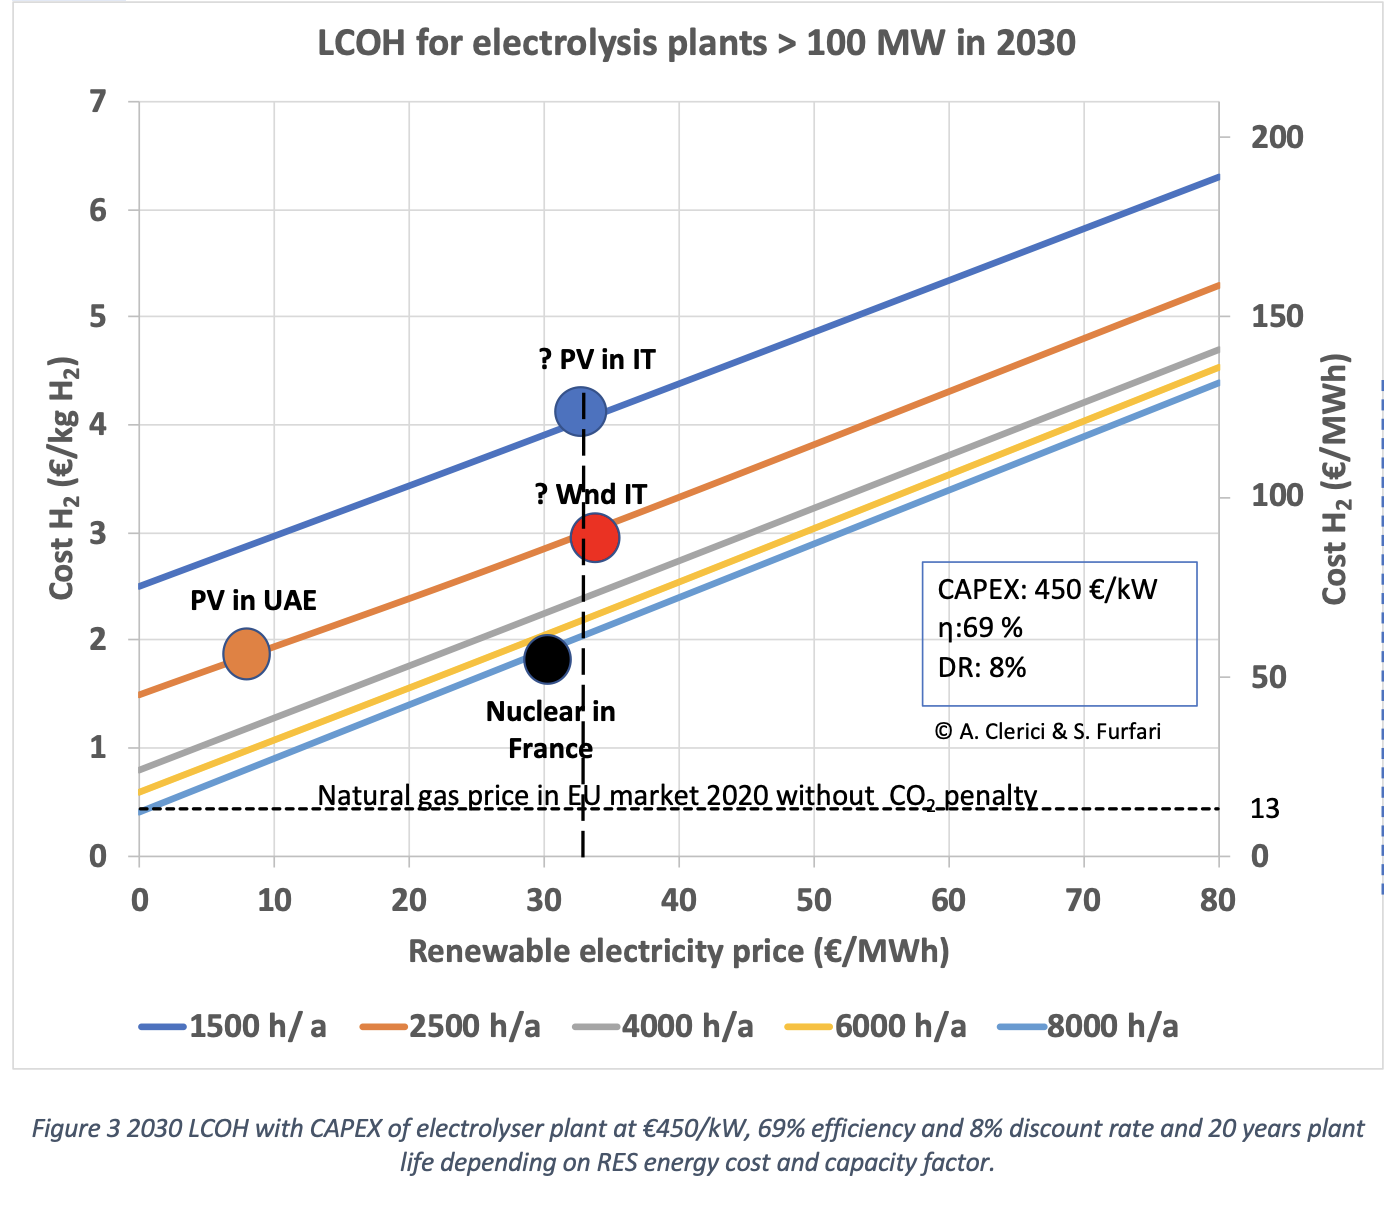
In 2030, even with a renewable price of €32/MWh (dotted line) and an electrolyser CAPEX of €450/kW and 69% efficiency, the hydrogen cost will be €4/kg for PV and €3/kg for wind energy. This price of €32/MWh is considered globally in the IEA scenarios. In EU Member States, it is a very optimistic price with new plants and a capacity factor of 1,500 hours for PV and 2,500 hours for wind, above the current average.
Compared with Figure 2, it can be seen from Figure 3 that as the CAPEX decreases, the cost gap between different capacity factors decreases as well.
Hydrogen Europe predicts, for 2030 in Germany, a green H₂ cost at the site of the electrolyser of €3/kg (€90/MWh). This is based on the following assumptions: a CAPEX of 100 MW electrolyser halved to €500/kW compared to 2020 values, 66% efficiency and renewable energy price at the electrolyser of €50/MWh from offshore wind with a capacity factor of 4,500 hours/year.
It would be necessary to reach in EU higher capacity factors and/or lower cost of renewable energy per MWh in order to approach the green hydrogen cost as that produced in areas where the energy price of renewable electricity is very low. This is the case in the Middle East, some areas of Africa, Australia and South America thanks to high insolation or windiness, local labour and land prices significantly lower than in the EU.
5. LCOH in 2050
By 2050, various well-known international organisations announce the cost of hydrogen at the mantra value of €1/kg. This forecast is based on a combination of renewable energy prices and its capacity factor unimaginable for most EU countries, and large hypothetical advances in electrolysers and their power output size.
The International Renewable Energy Agency (IRENA) assumes that large electrolysers of several 100 MW will cost $200/kW globally in 2050. With the other assumptions of IRENA, i.e. a load factor of renewables of 4,200 hours/year and a cost of $20/MWh, hydrogen at the outlet of the electrifier would cost $1.4/kg H₂ equal to 1.2/€ kg H₂.
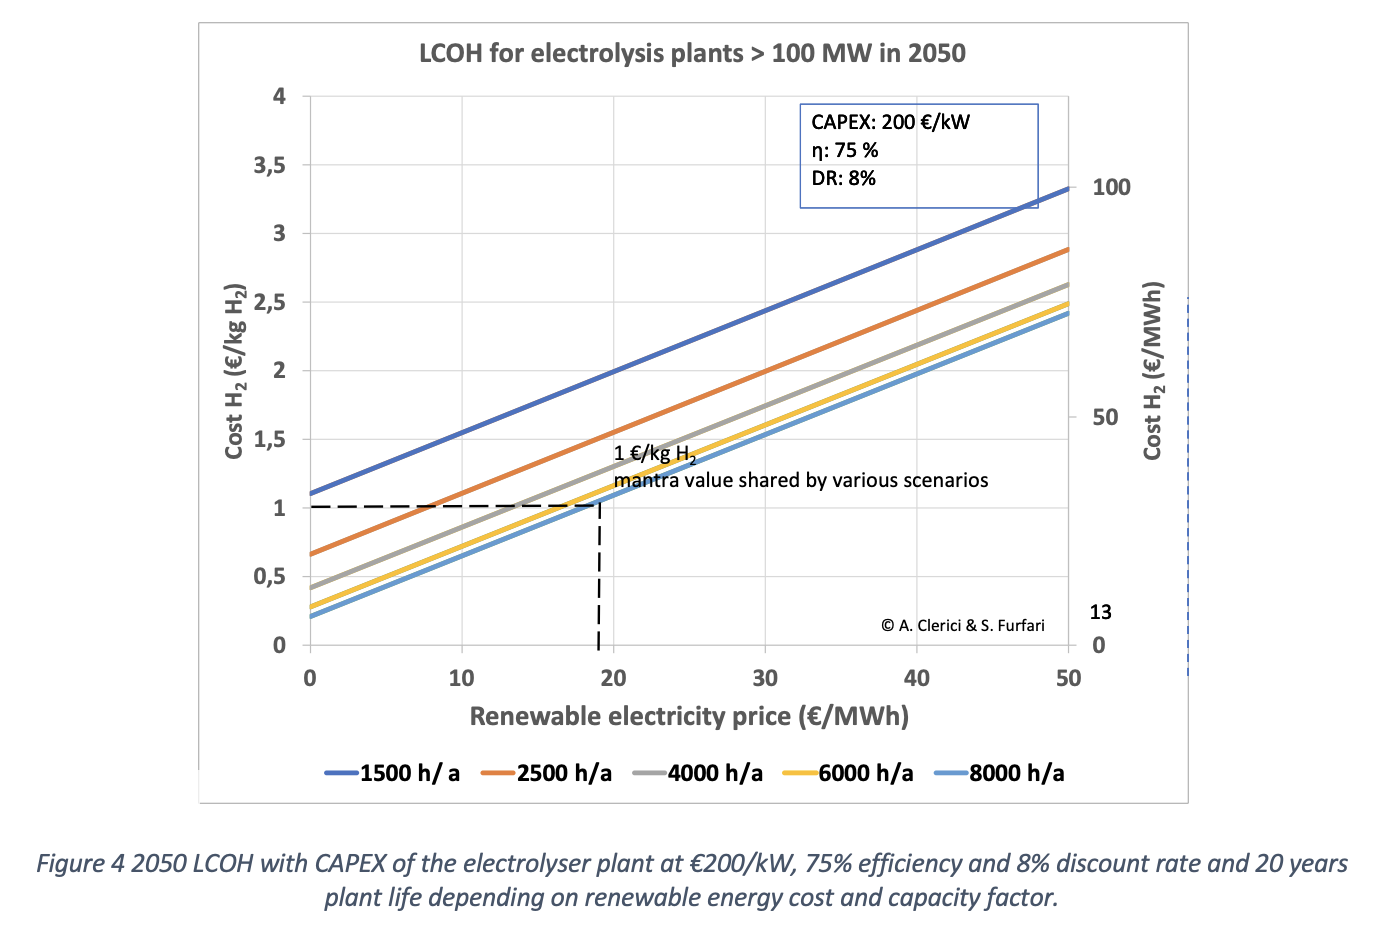
With a CAPEX of €200/kW and 75% of efficiency, LCOH values as a function of renewable electricity price and capacity factor are shown in Figure 4.
Even with €200/kW for electrolyser plants with 75% efficiency in 2050, with 1,500 hours/year of capacity factor it would take a negative renewable energy price to have an LCOH of €1/kg H₂. With 2,500 hours/year of load factor, a price of €7.5/MWh from RES would be needed to have an LCOH of €1/kg H₂.
Despite these optimistic assumptions, it should be remembered that the mantra value of €1/kg H₂ on which the main scenarios of the international agencies and organisations worldwide converge corresponds in energy terms to €30/MWh.
For comparison, it is worthwhile to consider that the wholesale price in 2020 of natural gas in the EU wholesale market was €13/MWh. To bring the price of natural gas up to €30/MWh to allow the green hydrogen to be competitive would mean penalising it with a CO2 price of €100/t CO2, which seems unlikely in an open, global world. This apart from the possible increase of prices of natural gas due to the energy transition trends with no financing funds for new developments of fossil-fuel production and use.
6. How to increase the capacity factor of a wind or PV electricity energy supply to an electrolyser
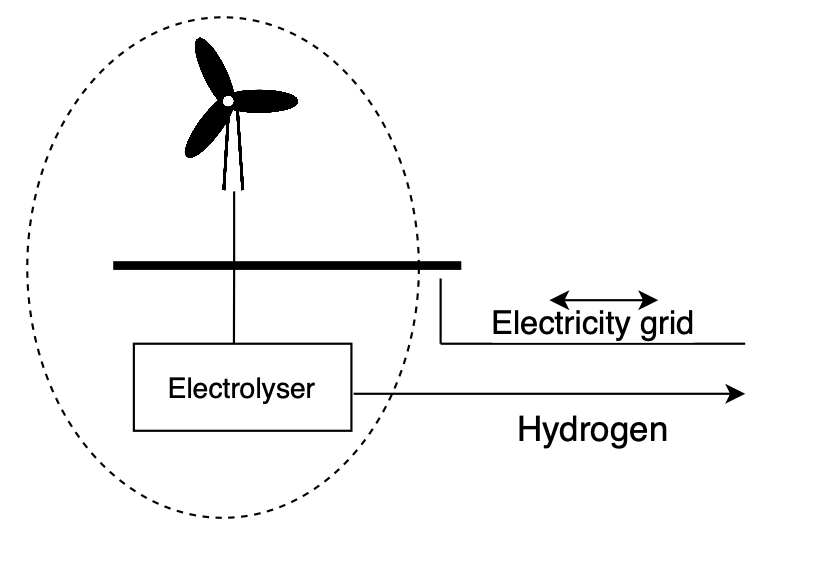
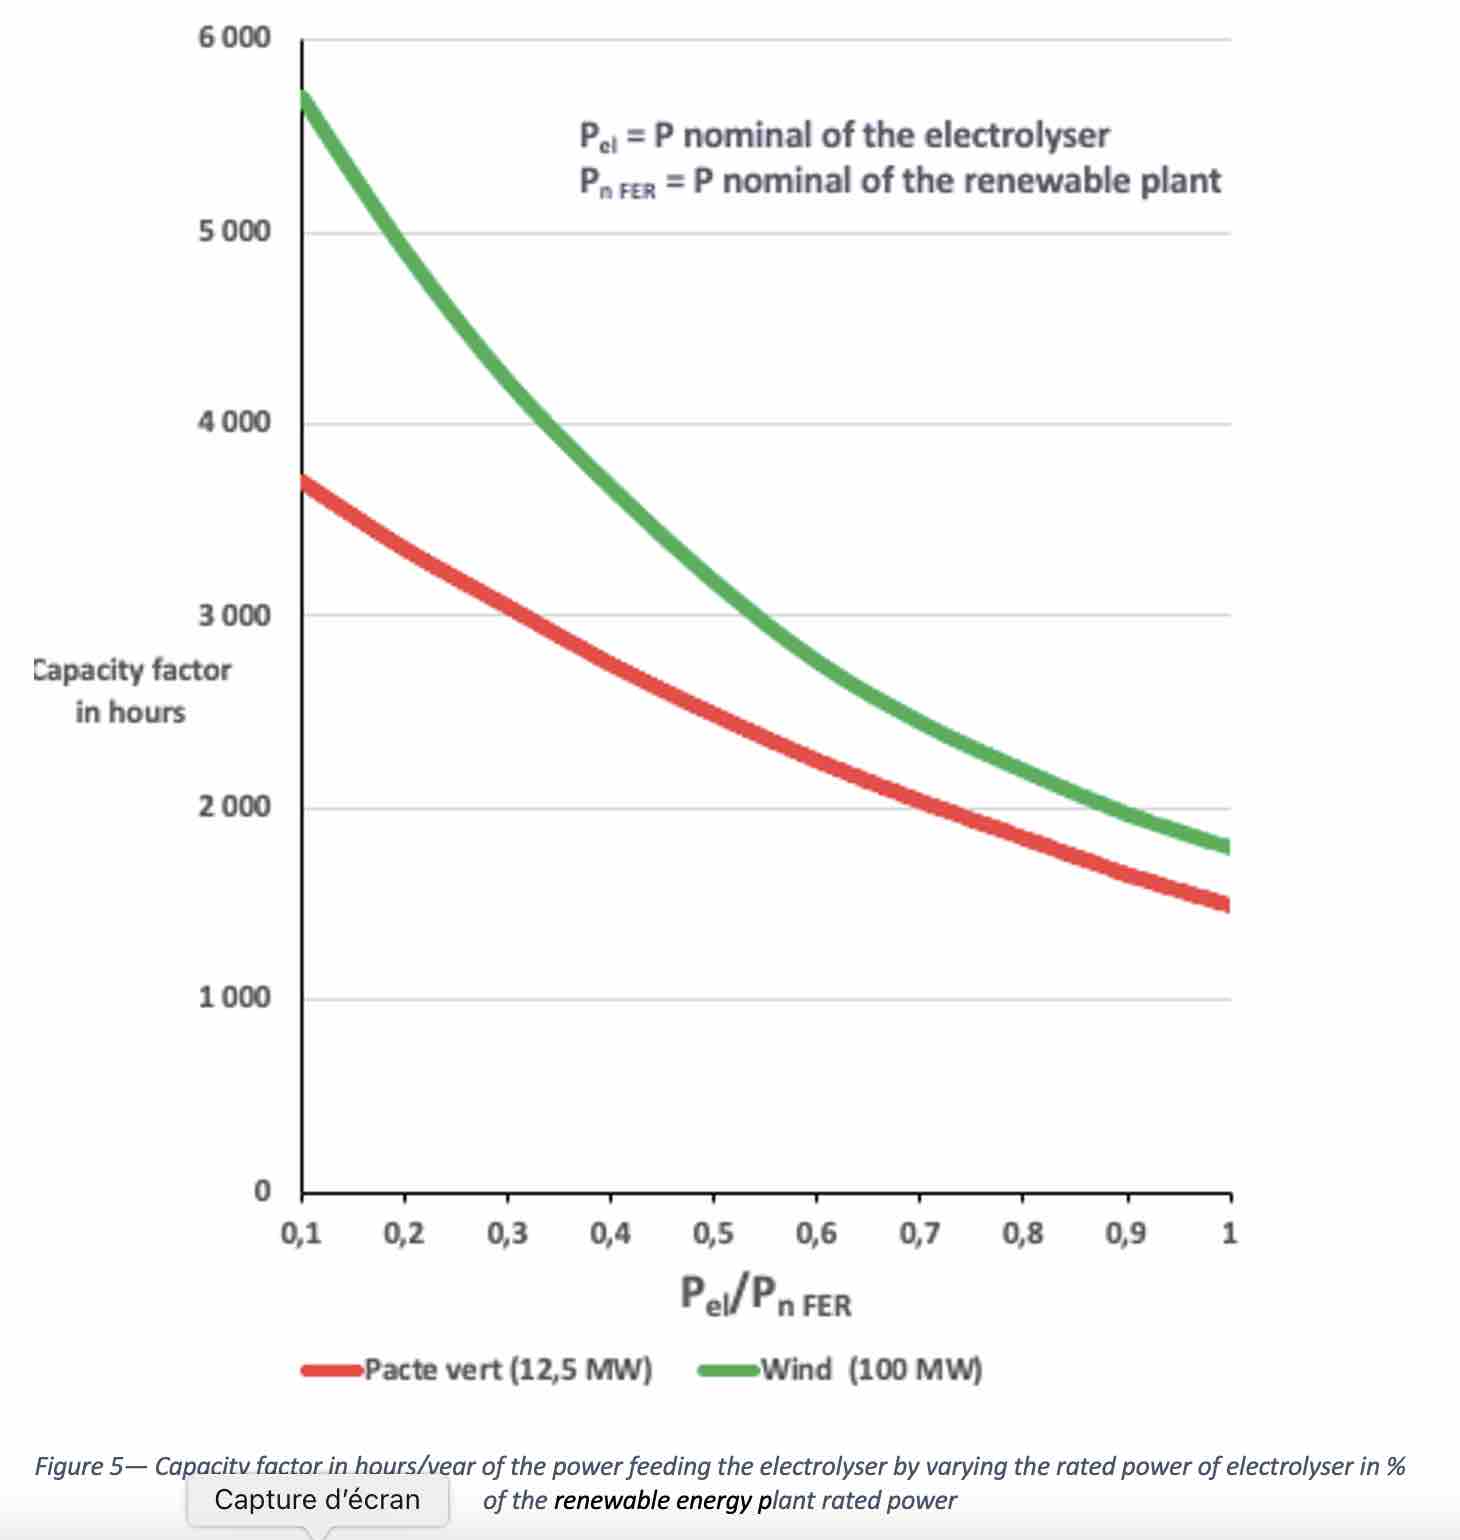
As from Clerici, Furfari in ‘il costo dell’idrogeno verde | l’astrolabio (amicidellaterra.it)’ this can be achieved connecting the electrolyser to the network and availing the advantages provided to self-consumption in order to avoid additional system charges: by a selection of the electrolyser rated power lower than the one of the renewable energy plant and selling the excess power to the network. The self-consumption of the electrolyser belonging to the owner of the renewable energy plant and located in the same site is exempted to pay network fees with present regulation at least in Italy. But who is paying for the impact on network services to deal with a small capacity factor of the residual power injected in the power system?
Figure 5 summarises the results of the performed computations for both the wind and PV actual plants in operation in the South of Italy as reported in our previous article in The European Physical Journal Plus.
With an electrolyser rated power at 30% of the renewable plant rated power, the capacity factor of the electricity supply is twice than the one of the original plant.
7. Conclusions
Clearly, a green hydrogen produced by renewable sources and which by burning produces only water vapour, taking care of its possible uses in many sectors is fascinating. A series of technological and economic challenges are, however, still open not only for its production on which the article has been focused, but also along the other rings of the complete chain: compression, storage, transport, distribution and final uses.
Only on the basis of the results of international cooperation in technological developments and prototype plants it will be possible to define concrete time objectives and real costs of green H₂ to final clients.
Proposing over-optimistic timescales and low energy costs for green hydrogen could be counterproductive. Even with the claimed mantra value for production of around €1/kg H₂, by 2050, the green hydrogen cost would be equivalent to an energy cost of €30/MWh at the electrolyser site. This should be compared to the €13/MWh of the EU gas market in 2020. To reach a value of €30/MWh, the carbon tax applied to gas should be €100/t of CO2.
The reported numbers by the European Commission of 10 Mt of green hydrogen produced in 2030 in the EU by 40 GW of electrolysers necessitate explanations by the Commission on their hypotheses and relevant costs reverted on H₂ production and the considered regulations.
In addition to a strong reduction of CAPEX of the electrolysers, in any case a key element for a low green H₂ production cost will be an appealing cost and appropriate capacity factor of wind and solar energy. Many EU Member States cannot compete with the values already got or foreseen in Australia, Middle East, North Africa and Chile.
With respect to the green H₂ production cost (first ring of the chain), detailed additional analyses are essential to verify the actual behaviour of the sophisticated electrolysis complexes when fed only by isolated and dedicated photovoltaic solar or wind plants with their variable and intermittent production of electricity. With international cooperation it is important to arrive for different technologies at reliable dynamic models validated by prototype tests. This would allow effective optimisations of H₂ costs in the different possible use of intermittent and variable wind and solar sources.
In any case it is worthwhile to remember the water requirements for large electrolysis complexes that it is more than 20 litres per kg of H₂ (more than double of the stoichiometric value).
To attract investors for an H₂ development, apart from adequate initial subsidies to green H₂ to allow its development, the following priorities should be considered:
- implementation of recognised safety international standards;
- clear and stable regulation rules at least at the EU level involving both electricity and gas sectors (electrons and molecules);
- early starting of an H₂ demand development with initials ‘reasonable’ prices by considering blue H₂ cheaper production costs; this in the temporary transition of a green H₂ cost reduction due to technology and scale effects;
- an effective communication to the population on the cost/benefits involved in the transition and in the H₂ contribution.
Special attention should be paid to a practical EU leadership in the future green H₂ market. Today technologies are quickly copied and the cost of final products will depend on local costs of prime materials (mainly imported into the EU), energy and personnel; today in China electrolysers at around €250/kW (that is a target in the EU after 2040) are already available. Let us remember the PV panel’s history.
This will imply a rethinking of an appropriate mix of a manufacturing industry and of a solution/system provider activity that to be competitive will include both the cheapest components of adequate quality and of workforce available in the market. Great requalification of skill of personnel and of the industrial sector must be considered in the EU.
The opposition of the majority of the EU to the construction of new nuclear power plants and the encouragement of the early shutdown of existing ones that could have a sensible life extension does not seem to be a rational approach; the possible temporary and safe life extension of existing plants will have a positive impact both on the reduction of CO2 emissions and on the cheap initial production of CO2-free blue hydrogen. It is important to note that in electricity generation, the primary energy source in the EU with the highest share in 2019 was nuclear power with a share of 25.6%, followed by gas (21.5%), coal (15.2%), wind (13.4%), hydroelectricity (10.8%), biomass (6.2%), photovoltaics (4.2%).
Particular attention should be paid to the consequences of a strong and precipitous opposition to the development and use of any type of fossil fuel. This has already led to a rapid ‘green washing’ of the financial world, with no discriminatory financing of fossil fuels in primary energy development or use. This will accelerate the rise in fossil fuel prices, lead to large stranded assets and create a potential energy supply shortage if the development of renewables does not meet the EU’s ambitious targets in time and value. Has this scenario been properly assessed in terms of the possible negative reactions of populations to a stable and effective climate transition? Has this strategy considered the development of sovereignty and populism with the risk of not having an EU of 27 Member States before 2050? The real danger of the energy transition lies in implementing it too quickly without having assessed the excessive energy costs and without having communicated properly to citizens and industries.
A good article on pricing of green hydrogen.
Pl a soft copy
I Dr Himmat Singh Is interested in this subject
I have been Scientist ‘G’ and professor and retired
My email is drhimmas@gmail.com
Shall be thankful for your response
Dr Himmat Singh
DehraDun ,India
Re the cost of grey hydrogen currently in UK due to Putin – The cost of production of grey hydrogen in the UK has increased from $US1.9 per kg in April to $US8 per kg in October, while the cost of green hydrogen remained unchanged at $US4.5 per kg. Yes, if/when gas prices drop then grey hydrogen price will drop too, but who knows when? It’s a fact that prices and installations of solar and wind have dropped far more in cost and increased much faster in installations over the last 10 years that just about anybody predicted (although Greenpeace were closer than IEA etc, even they underestimated). Now as battery prices have also dropped rapidly, it would be a very rational conclusion to predict that green hydrogen (as it will be produced from cheaper and cheaper solar and wind), will also drop faster in price, and grow faster in quantity than most people predict. An example of how quickly the price predictions are moving: In January 2020, Bloomberg predicted that Green Hydrogen would be competitive with fossil fuel hydrogen and could replace gas by 2050 Just a few months later, in April 2020, they reduced that 2050 target by 10 years to 2040. A year later, in April 2021, they reduced that 2040 target by 10 years to 2030. So in the space of just 15 months, they have brought forward their cost competitive timeline by a huge 20 years! Would anybody really be surprised if that 2030 target is actually hit even earlier? If so, they would be ignoring the experience of solar, wind and batteries over the last 10 years, and the fact that governments all over the world are racing to become « green hydrogen superpowers ». Any gamblers out there want to bet against it? (P.S. I’m not a licensed bookmaker sorry).
@ Robert Adams :
Thank you for your reaction. Two points, but there are others.
Board members do not take DIFs on the basis of transitional prices because they know that these prices will not last.
If the price of oil or gas goes up, ALL prices go up as well because EVERYTHING depends on fossil fuels.
Anyway, I am not an investor and if people are willing to invest, they can. I am not stopping them.
« This should be compared to the €13/MWh of the EU gas market in 2020. »
Wow how that price has dated – 7 months after the invasion of Ukraine, it’s still waaaaaay over that! Also, the constant overuse of the word « mantra » is extremely patronising, as though it’s some kind of esoteric chanting. The U.S. DOE has a « moonshot » goal of $US1 for 1 kg of hydrogen with 10 years. That’s not a « mantra », that’s the aim of the richest and most powerful country on Earth. 2050? That will be at least 2 decades after the « »claimed mantra value for production of around €1/kg H₂, by 2050, « .
Electrolyser breakthroughs are coming and they will come fast.
here’s one you may have missed: Now efficiency up to 95%, so the 75% in the article will soon be a legacy percentage:
https://www.uow.edu.au/media/2022/breakthrough-opens-door-to-low-cost-green-hydrogen.php
A Green H2 storage breakthrough:
https://reneweconomy.com.au/eureka-moment-as-australian-researchers-make-hydrogen-storage-breakthrough/
And the need to be close to large sources of clean water? Well…
https://reneweconomy.com.au/researchers-pluck-green-hydrogen-from-the-air-without-any-need-for-liquid-water/
Green H2 is unstoppable and Europe is hungry for it.
Our article was based on the prices (natural gas and others) in effect at the time. You cannot expect the articles to be updated every time the price changes. Moreover, the price of gas cannot – should not! – remain at this level. It will be unbearable for everyone. Huge investments to provide enough gas to replace Russian gas are already underway and therefore the price of gas will return to a more reasonable level, as it was before the war. Moreover, these new investments are here to stay and the supply contracts to get a share of the new production will be forced on Germany and other countries by long-term contracts. So natural gas is here to stay. Gas for blue hydrogen production will therefore be available the day there is a market for hydrogen as a fuel. For the time being, this market does not exist, except for a few niches.
The efficiency of electrolysis depends above all on thermodynamics: the theoretical maximum efficiency of the stack is 75% but that of the complete installation is lower, as you can see in our article which was just presented at CIGRE 2022 the last week of August (the article was written in April). The article is available for purchase at http://www.e-cigre.org.
For the other questions, it is a matter of believing in the research conducted at the European Commission’s Joint Research Centre in Ispra since 1959.
Since Mr. Robert Adams likes the « inconsiderate and somehow biaised » use of H2, let’s try to vary our sources and opinions?
Of course, taking into account elements such as « end-to-end useability & profitability » of the whole process. So, ultimately, the KEY economic feasibility that will predict the sustainability of the idea… beyond its current political hype (that’s to say european => mostly german, the french remaining gentle followers)!
Another SOURCE (sorry, here in French) : « « Aperçus sur l’hydrogène » »
= = = = = = = = = = = = = = = = = =
Publié le 25 avril 2021 Auteur : Frédéric LIVET
[[ Résumé :
L’Hydrogène est aujourd’hui un produit industriel bien maîtrisé comme produit chimique dans la fabrication des engrais ou le traitement des pétroles. Comme on espère l’utiliser pour pallier l’intermittence des renouvelables, il a été récemment promu comme un vecteur essentiel dans l’économie de l’énergie. Si on entend s’affranchir du nucléaire pilotable, il convient d’en produire de grandes quantités pour générer de l’électricité dans les périodes sans vent et sans soleil.
Dans cet aperçu, les méthodes de production sont d’abord discutées. Sans émissions de CO2, l’électrolyse s’impose, malgré son coût de revient élevé, mais le gaz reste dans la course si le CO2 est stocké. Malheureusement, le cycle électricité-hydrogène-électricité a un faible rendement (30 % ?). C’est encore pire si on passe par l’intermédiaire du méthane, gaz « vert » obtenu à partir de l’hydrogène (PtG).
Il convient alors de valoriser davantage les autres utilisations de l’hydrogène. On montre que la première envisagée, l’automobile, semble peu adaptée quand on la compare aux batteries électriques. Maintenant, les recherches se tournent plutôt vers les poids lourds, les trains et l’aéronautique, où le remplacement des hydrocarbures émetteurs de CO2 est envisagé.
Cependant, le remplacement des hydrocarbures par l’hydrogène nécessite une grande quantité d’électricité, énergie coûteuse et de grande qualité. Or, dans le même temps, il existe sur le marché d’importantes disponibilités en gaz naturel. Et le développement de l’hydrogène, s’il doit être rapide, sera probablement dépendant du gaz naturel, qui, en l’absence de capture, est un gros émetteur de CO2 (presque le tiers des émissions françaises).
On peut donner dans un tableau le résumé de la situation actuelle et de l’influence du prix du CO2 (avec l’électricité à 70 €/MWh, le charbon à 60 $/t et le gaz à 20 $/MWh, on confond $ et €)
Usefull table to be read there …
https://www.sauvonsleclimat.org/fr/base-documentaire/apercus-sur-l-hydrogene
…………………………………………………………………
Dear Rob Adams : Let’s read this long article ?
(Though, GAS is here to stay, wathever the silly IPCC/GIEC ideologies) !
Greetings, from the « Capital of the EU »